

Many advertisers panic when opening Facebook Ads Manager and seeing an account overview filled with red arrows, declining metrics, or “underperforming” indicators. However, a “bad-looking” Facebook Ads Manager Account Overview does not necessarily mean your advertising performance is failing. In most cases, it reflects how Meta’s reporting logic, attribution models, and optimization signals interact with your account structure, campaign lifecycle, and data maturity.
Understanding why your Ads Manager overview looks bad is essential for making correct optimization decisions and avoiding unnecessary budget cuts or structural changes.
Ads Manager Overview Is Not a Performance Verdict
The Facebook Ads Manager Account Overview is a high-level diagnostic dashboard, not a granular performance analysis tool. It prioritizes short-term trends, default attribution windows, and aggregated metrics, which can distort the real efficiency of your campaigns.
For example, Meta’s default attribution setting is 7-day click and 1-day view. According to Meta internal benchmarks, advertisers in high-consideration industries (SaaS, B2B, education, high-ticket eCommerce) often see 30–50% of conversions occur after day 7. These conversions are excluded from the default overview, making performance appear weaker than reality.
Learning Phase and Algorithmic Volatility
One of the most common reasons a Facebook Ads Account Overview looks poor is frequent learning phase resets. Any significant change, budget adjustments above 20%, creative swaps, audience changes, or bid strategy updates can push ad sets back into the learning phase.
Meta data indicates that ad sets exiting the learning phase typically show:
- 15–25% lower CPA
- More stable CPM and CTR
- Higher conversion rate consistency
If your account overview shows unstable results, high CPA spikes, or inconsistent ROAS, it often means your account structure is preventing the algorithm from stabilizing, not that your targeting or creatives are ineffective.
Aggregated Metrics Hide Winning Segments
The Ads Manager overview aggregates performance across campaigns, ad sets, placements, and audiences. This creates a misleading picture when:
- Prospecting and retargeting campaigns are combined
- High-spend scaling campaigns dilute smaller high-ROAS tests
- Broad targeting overlaps with stacked interest audiences
For example, an account with:
- Prospecting ROAS: 1.4
- Retargeting ROAS: 6.2
May still show an overall ROAS of 2.1, triggering concern—despite retargeting performing exceptionally well. Professionals should always drill down into breakdowns by placement, audience type, and funnel stage, rather than relying on the overview.
Attribution Loss and iOS Privacy Impact
Since iOS 14.5+, Meta reports that conversion signal loss can reach 20–40% depending on industry and tracking setup. Even with Aggregated Event Measurement (AEM) and Conversion API (CAPI) implemented, the Ads Manager overview still underreports performance for many advertisers.
If your Facebook Ads Account does not have:
- Proper domain verification
- Correct event prioritization
- Server-side tracking via CAPI
Your account overview will systematically understate conversions and ROAS, especially for mobile-heavy traffic.
Short Reporting Windows Create False Negatives
The default Ads Manager overview often emphasizes day-over-day or last 7 days comparisons, which is problematic for accounts with:
- Longer sales cycles
- High-ticket products
- Seasonal demand fluctuations
Experienced media buyers evaluate performance using 14, 30, or 60-day blended data, combined with backend metrics such as MER (Marketing Efficiency Ratio) and LTV-to-CAC. When viewed in isolation, Ads Manager can look “bad” while the business remains profitable.
Creative Fatigue Misinterpretation
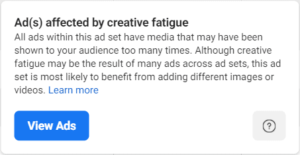
A declining CTR or rising CPM in the overview does not always indicate creative fatigue. Meta’s auction dynamics mean CPM inflation can be driven by:
- Increased competition during peak periods
- Expansion into broader audiences
- Algorithmic exploration during scaling
Industry benchmarks show that during aggressive scaling, CPMs can increase 20–35% while total revenue still grows profitably. The overview fails to contextualize this nuance.
What Experts Do Instead of Trusting the Overview
Seasoned Facebook Ads professionals treat the Account Overview as a warning system, not a decision engine. They rely on:
- Custom columns aligned with business KPIs
- Funnel-based campaign segmentation
- Incrementality testing and holdout experiments
- Blended attribution models (GA4, CRM, Shopify, backend data)
In short, experts understand that Ads Manager reports platform efficiency, not business truth.
Final Thoughts
A “bad-looking” Facebook Ads Manager Account Overview is rarely a true reflection of performance. It is usually the result of attribution limitations, learning phase instability, aggregated reporting, or misaligned evaluation windows. The key is not to optimize for what looks good in Ads Manager, but for what drives sustainable, profitable growth at the business level.
If you understand how Meta’s advertising system interprets data, you gain the ability to see beyond surface-level metrics and that is where real Facebook Ads expertise begins.